

How to Measure Push Performance (Hint: It’s Not Open Rates)
Slater Smith on Aug 16, 2022
Measuring your campaigns’ performance is a critical part of marketing, but push notifications can throw your usual KPI targets for a loop. That’s because many marketers see much lower open rates for push compared to emails. If this sounds like you, you may have found yourself asking questions like, “Oh no! Are my messages underperforming?” Or worse… “Is my SDK integration broken?!”
The good news is that low push open rates are very normal! In fact, the median open rate for push notifications is just 4.6% on Android and 3.1% on iOS. While your rates may vary, low open rates alone usually aren’t cause for concern.
Learn why, plus tips on how to gather meaningful push metrics that don’t rely solely on opens.
Open rate differences: Push vs. email
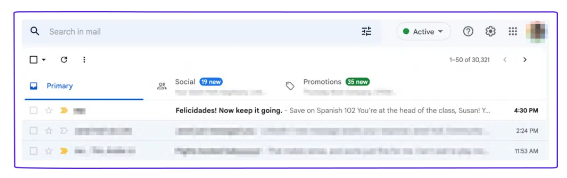
Imagine you have a language-learning app, and you’re sending a campaign to customers who completed the Spanish 101 course. A personalized email message might look like this:
Subject line: Felicidades! Now keep it going.
Preheader text: Save on Spanish 102
Body: You’re at the head of the class, Susan! You aced Spanish 101 in just 4 weeks. Don’t stop now: Spanish 102 te llama! Earn 40% off when you start this week.
The subject line can only entice Susan to read more; she has to open the email to get the full content. Thus, tracking email open rates gives you strong evidence about the effectiveness of your subject lines and preheader text.
Now let’s see a similar personalized message in push:
Title: Way to ace Spanish 101, Susan!
Body: Felicidades on finishing Spanish 101 in just 4 weeks! Visit the app today for an exclusive discount: 40% off of Spanish 102.

To actually open the push, Susan would have to tap the notification or trigger the app. But unlike with the email, she gets the key message content even if she just glances at the notification without opening it.
Let’s say she’s in a meeting when the notification pops up, so she quickly looks down at her phone and then dismisses the message, making a mental note to sign up later that day. During her lunch break, she opens the app and signs up for Spanish 102. The push converted, even though she never opened it. But if you’re only measuring push performance with open rates, you’ll never know the message was successful.
Bottom line: Push open rates don’t tell you nearly as much about campaign success as email open rates do.
Open rate differences: Android vs. iOS
Push open rates on Android devices are consistently higher than on iOS devices, which confuses a lot of marketers when analyzing their data. But the discrepancy doesn’t necessarily reflect customer behavior; it’s a function of the user interface.
iOS notifications are displayed once and then moved to the message center. People see the message when it pops up, but they don’t have to touch the screen to dismiss it.
Android notifications, on the other hand, stick around until you manually swipe to dismiss them. While that can give customers more of a chance to engage, it also leads to accidental opens when people are trying to clear their notifications.
Bottom line: Don’t put too much stock into the difference between Android and iOS open rates.
How to actually measure push engagement
If open rates don’t effectively track push engagement, how do you know if your campaigns are performing? Simple: monitor customer behavior and make smart inferences.
Let’s return to the earlier example of Susan’s unopened push notification. If she receives it at 10:00 a.m. and signs up for Spanish 102 at 12:45 p.m., you can infer that the push caused the conversion. In fact, any conversion that occurs within a day or two of a push campaign is a strong indicator of engagement. As you measure behavior over time, you might discover your customers respond within a shorter or longer interval.
It’s easy to track push engagement with Customer.io’s SDK: just add a conversion goal to your campaign.
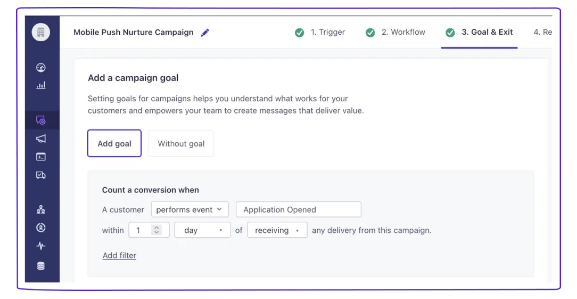
Conversion goals in Customer.io are fully customizable; you define the behaviors and timeframes that are meaningful for your customers.
Bottom line: SDKs with customized conversion goals give you far better insight into push performance than open rates.
Start measuring push performance the smart way
Imagine you get two ads in your mailbox today: one’s a letter in an envelope, the other’s a postcard. If you recycle the letter without opening it, you’ll never know what it said. But with the postcard, you likely got the gist in a glance as you took it out of the mailbox.
Keep that metaphor in mind when looking at push notification open rates. Low numbers don’t necessarily mean something’s wrong. You just need to measure engagement differently than you do with email.
And if you add conversion goals to your campaigns and discover your push messages truly aren’t performing, our A/B testing and random cohort tools will help you hone your campaign until it hits every KPI.
Bottom line: Open rates don’t tell the whole story when it comes to push, but you have the tools you need to measure and optimize for success.